Interpretation of High Resolution CT of the lung (HRCT) is based on recognition and description of pathological patterns. Numerous flowcharts are presented in the available literature on HRCT, often one for each pattern. Consequently, HRCT can be perceived as rather inaccessible. This book organizes the flowcharts for the various patterns into one easy-to-use algorithm in the hope of creating a simple tool to aid diagnosis.
The first part of the book describes the various patterns that can be found in HRCT. The second section comprises an overview of differential diagnosis, including sample scans and descriptions of typical findings. A list of highly recommended literature on HRCT can be found at the end of the book.
Technical aspects of HRCT
In the early days of HRCT the examination involved taking sequential thin sections (1-1.5 mm) in intervals of 10 to 20 mm. Using existing volumetric scanning techniques, both thin and thick (5 mm) sections can be reconstructed from the same scan. In HRCT a high spatial frequency or “sharp” reconstruction algorithm is used.
What an HRCT protocol should include is open to debate. In our experience an HRCT examination should include both thick and thin transverse sections and coronal and sagittal reformats. Diagnosis of air trapping requires 4 or 5 transverse sections in expiration. An inspiratory phase (full inspiration) series with the patient in the prone position can help characterize normal dependent opacities.
Preferably, the scan should be performed without contrast medium. Note that high concentrations of contrast in the lung parenchyma, for example in CT-angio for pulmonary embolism, can result in increased patchy parenchymal attenuation, which can be falsely interpreted as groundglass opacity.
The HRCT algorithm
The algorithm in this book is intended to assist in finding probable diagnoses based on recognition of patterns. Initially patterns are grouped under high and low attenuation as follows:
Increased attenuation: nodules, ground-glass, reticular pattern, consolidation Decreased attenuation: cystic pattern, mosaic perfusion
Subsequently some of the patterns are divided into subgroups. Finally, at the lowest level of the algorithm a number of differential diagnoses are listed for each pattern or subpattern. Note that some of the diagnoses may also be manifestations of systemic rheumatoid diseases or part of a drug reaction. Typical findings for these and other differential diagnoses are described and illustrated in the second part of the book (Chapters 7-20).
Lobule (secondary lobule)
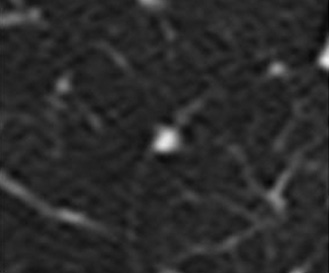
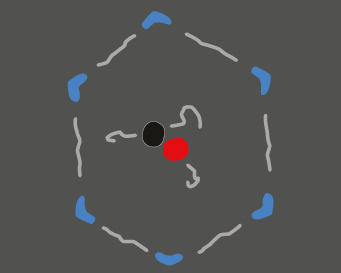
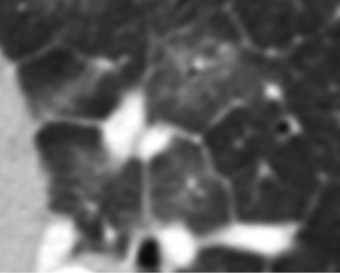
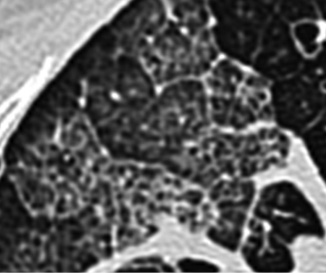
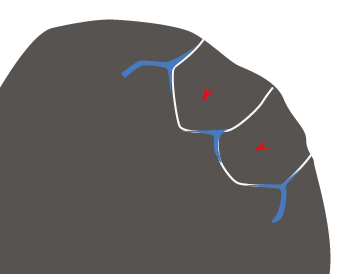
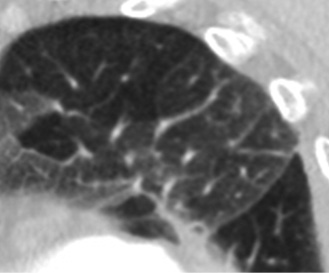
Structures within the secondary lobule are the key to HRCT interpretation. A secondary lobule is the smallest functional lung unit identifiable on CT (1-2.5 cm). Each secondary lobule contains up to a dozen acini, each of which consists of groups of alveoli (primary lobules). In a healthy secondary lobule, an artery can be identified centrally and veins peripherally. Adjacent to the artery is a bronchiole, the walls of which are normally too thin to visualize. There are also lymph vessels – some peripheral and some centrilobular – which can only be seen when they are dilated (pathological). There is also connective tissue stroma (both in the lobular periphery and intralobular parenchyma) that cannot usually be visualized radiographically.
Since the term primary lobule is no longer in common use, the terms lobule and secondary lobule should be considered synonymous in this book.
Useful diagnostic and procedural tips
Obtaining a detailed patient history plus laboratory and respiratory physiology tests is mandatory. Are there signs of infection or heart failure? Is there any indication of systemic rheumatoid disease? Is the patient on any medication? Has the patient been exposed to dusts, birds etc? History of smoking?
Many of the diseases with pulmonary involvement are long-standing and dynamic. Always check for previous radiological examinations for comparison.
When approaching an HRCT examination, never start by suggesting a diagnosis based on a general impression. Instead, look for pattern or patterns, and use the algorithm to identify potential diagnoses.
Compare the clinical findings with your list of potential diagnoses. Usually some can be excluded, and the resultant report will contain one or a few differential diagnoses. Keep in mind that common things happen commonly, and that the patient may suffer from several comorbidities (e.g., heart failure and fibrosis).
Sometimes clinical follow-up and repeated scans will be required before a diagnosis can be established. Many HRCT diagnoses are based on exclusion, i.e., drug reactions. In selected cases an open lung biopsy is required for a definite diagnosis. Note that in some cases, a mixture of findings may coexist, such as organizing pneumonia and usual interstitial pneumonia in the same biopsy.
Good luck!
3 replies on “Introduction to HRCT”
excelente presentaciòn, muy didàctico. gracias.
Thank you! A new edition 2025 now available.
My husband has just be diagnosed w rheumatoid arthritis and ASS disease .
Per his doc- he went to UT southwestern here in dallas for lung scan-
Findings lead me to this link & thus your invitation to leave a reply.
Here are his readings –
file:///var/mobile/Library/SMS/Attachments/46/06/F5947FF4-0815-4ED2-8992-38673A2C5592/IMG_0795.jpeg
file:///var/mobile/Library/SMS/Attachments/1e/14/CEE30027-1E9E-417A-A207-29FFF2BA2FCE/IMG_0796.jpeg
file:///var/mobile/Library/SMS/Attachments/53/03/443AE478-C157-4D1E-B683-D9D74E7687CF/IMG_0797.jpeg
Any advice or recommendations that may support / educate us would be appreciated.